If you have ever done any research on tracking online data, you surely must have come across Google Analytics. The question that most people find difficult to answer is: What does Google Analytics do?
Google Analytics is a free website analytics service that gives you data about how visitors find your site and how they interact with it. Consequently, it makes it easy to track your digital ROI.
Let us now look answer the question: what does Google Analytics do?
Sorting Your Visitors Based on Various Dimensions
Google Analytics is designed in such a way that you can sort your visitors using a myriad of dimensions. And Google Analytics allows you to integrate other products from Google such as Search Console and Adwords.
The only requirement is that you install some tracking code provided by Google on every page of your website. This is what enables Google Analytics to track the activity on your site.
The Things That Google Analytics Measures
Google Analytics reports is built from the ground up on two pillars: dimensions and metrics and this is very important if you want to know the answer to the question: What does Google Analytics do?
What’s the difference?
Dimensions refer to the attributes present in your data. For example: where does your traffic come from? Which pages are you measuring?
On the other hand, metrics refer to the numbers for each dimension. A good example is if you are getting 1,000 visitors from New York, the 1,000 is the metric.
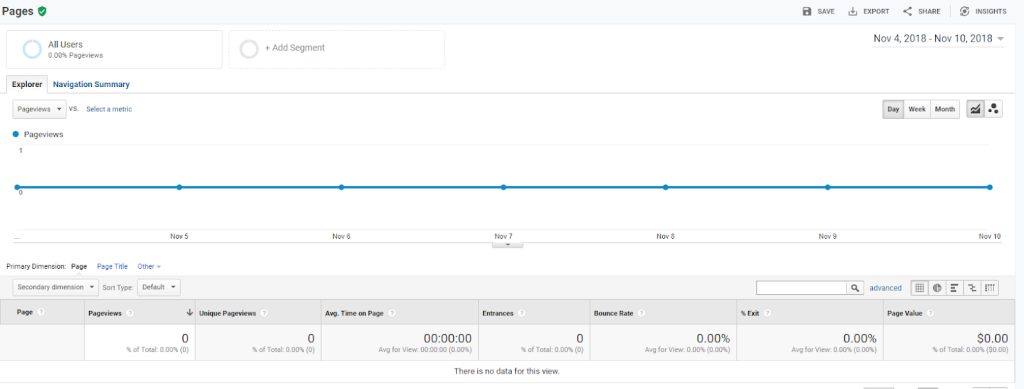
Google Analytics is all about dimensions and metrics. In the above image, we see the page’s dimensions and metrics.
In Google Analytics, metrics and dimensions are the basics of every single report.
What Can You Do With Google Analytics?
Rather than guess, Google Analytics reports give you the data you need to make proper decisions. It can help you justify whether or not to buy more advertising, and where to buy.
All data and reports in Google Analytics are grouped into Audience, Acquisition, Behavior, and Conversions.
All the data in Google Analytics is grouped into what is simply referred to as the ABCs. These refer to Audience, Acquisition, Behavior, and Conversions. Let us look at these now.
Acquisition
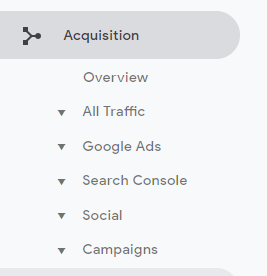
Simply put, the Acquisition reports section shows you how you get website traffic. Google Analytics gives you an overview of all your traffic sources. You can also look at the audience behavior and traffic channels.
The Acquisition reports show you how the users got on your site. This allows you to see your best and worst traffic sources.
With acquisition reports, you can determine the best traffic sources for your site.
Behavior
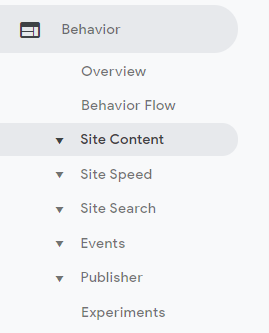
Reports in the Behavior section show you what the visitors do on your site. This allows you to check whether or not the visitors are taking the steps you want them to take.
Behavior reports show you how users behave once they get on the website.
Similar to the Acquisition reports, the Behavior reports section also has an overview. This shows you the volume of traffic your site received during the time you are looking at.
Conversions
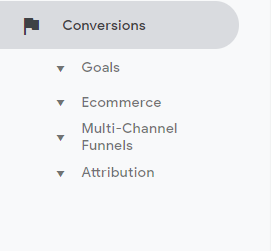
This section shows you how people convert on your website. With this data, you can find ways of improving your conversion rate. Conversion reports are grouped into goals, e-commerce, multi-channel funnel, and attribution.
The conversions section shows you reports on how your campaigns are performing and whether users are taking the right action.
The Goals section shows you the number of goals completed/conversions on your site. The E-commerce section shows you the conversion rate of your e-commerce site, the average order value, and unique purchases.
The Multi-Channel Funnels section gives you a complete view of the customer’s journey. This section helps you see the steps visitors take to convert such as signing up for a newsletter.
The Attribution reports section has the Model Comparison Tool. This helps you understand how your conversion changes when you change attribution.
Let’s say you think an advert as the user’s first touchpoint should get the conversion. This section lets you see how the conversion figures change as you change the attribution.
As such, you can see how your marketing efforts affect your overall conversions.
What Does Google Analytics Do? A Review
Now you have the answer to the question: What does Google Analytics do? Basically, knowing the source of your audience, their characteristics and their behavior on your phone.
Geeks of Digital is a data analytics and content creation agency. Get in touch with Geeks of Digital today to get help setting up and using Google Analytics.

