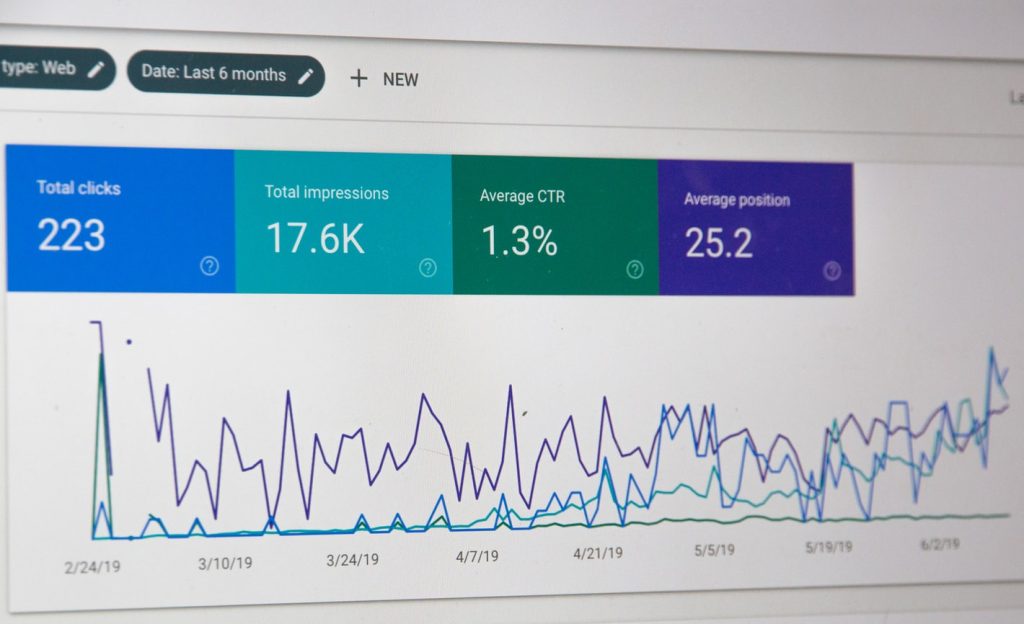
The fact of the matter is that the homepage is not always the first page visitors see when they land on your site. When visitors come to your site, they have different intentions and can get to your site in a variety of ways.
In this article, I will show you how to quickly analyze your landing pages using the landing page report Google Analytics so as to identify the best and worst performers.
How to Determine the Most Popular Landing Pages
To discover the most popular landing pages in Google Analytics, simply navigate to Behavior > Site Content > Landing Pages. This is the landing page report Google Analytics.
Here, you will see the percentage of visitors landing on each page, including the homepage.
How to Compare Landing Page Statistics
There is a formula for analyzing the landing page statistics in Google Analytics. First, go to your most popular pages and look at the following metrics:
The Bounce Rate
The bounce rate refers to the percentage of visitors that enter the site and leave without navigating to another page. As such, the bounce rate shows you the number of people who did not find what they were seeking.
Pages/Session
This is the number of pages that an average visitor navigates to after landing on your website. Look at this metric on other landing pages to find out if a certain page is better or worse.
Average Session Duration
This metric shows you the average time a visitor spends on the site after landing on a webpage. You should compare this metric to other landing pages to understand how different pages are performing.
Goal/E-commerce Conversion Rate
This metric shows you the percentage of visitors that convert from a particular landing page. Before you get any data from this report, you need to set up goal tracking correctly.
Then, compare this metric to the site’s average conversion rate. The great thing is that Google Analytics has a comparison tool that makes it easier to visualize the data, rather than staring at raw figures.
Past Landing Page Statistics
When you click on an individual landing page, you can see the statistics for that page alone. You may also apply a filter to see your page’s performance from different perspectives.
In case a big change has been made to the site, you will notice its effect as you change the view from weekly to monthly, to quarterly.
When you compare two metrics at the same time in the Landing Page report, you can get useful information about the page performance over time.
Statistics for Ecommerce Landing Pages
If you’ve set up e-commerce tracking to record the amounts of revenue, you can determine the worth of each landing page using monetary values. Based on the chart type you have chosen, you will see how much each landing page contributes to the overall revenue.
Also note that as your brand grows and you get repeat customers, your homepage will likely be the most popular entry point for visitors.
Conclusion – Using the Landing Page Report Google Analytics
The Landing Pages report in Google Analytics is the best place to learn where people land on your site. You can then optimize your content so that you get repeat visitors and increase your conversion rate.
Geeks of Digital is an analytics-driven online marketing and content production agency. We are experts when it comes to Google Analytics. Get in touch so we can use Analytics to take your business to the next level.


