If you are new to Google Analytics, you may find that the array of available reports can be quite overwhelming. You may be wondering where to start and where the most useful data lives. This is the job of Google Analytics standard reports.
In this article, we look at Google Analytics standard reports. These refer to the default reports listed on the left-hand panel Analytics. These reports give data about every part of the site.
Audience Reports
The secret to what a Google Analytics report does lies in its name. The Audience reports give you information about the people coming to your site.
Audience Overview
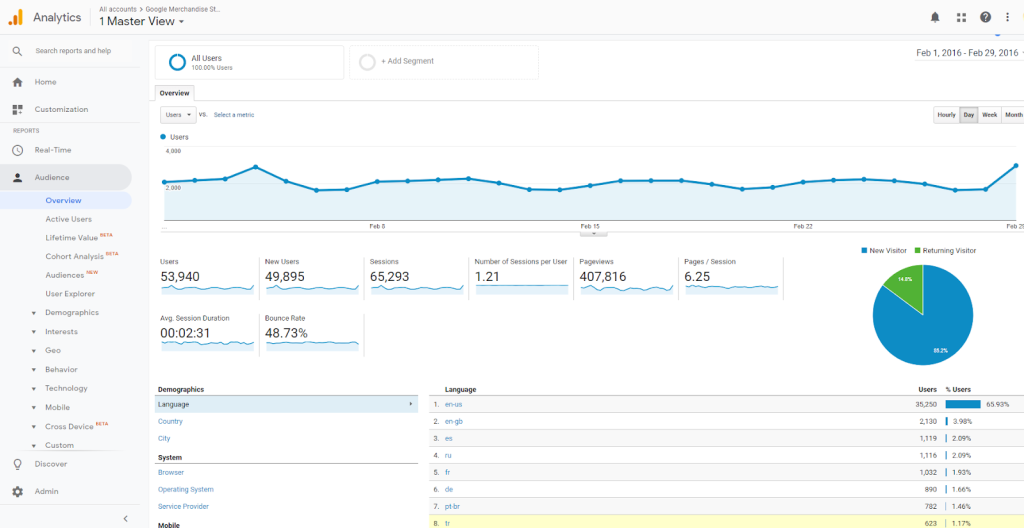
This gives you an at-a-glance view of your site. This report is not real-time but gives you a snapshot of your site’s audience at a particular time.
Information includes unique users, pageviews, sessions, pageviews, bounce rates and others.
By default, this is usually on a weekly basis. Nevertheless, you may use the dropdown calendar to adjust this time to the period you want.
Active Users
This shows you how many unique users have visited the website in the chosen period. This report is particularly useful when you want to understand the impact of promotional campaigns.
Lifetime Value
This report is more for Google Analytics users who operate e-commerce websites. You also need to activate e-commerce tracking in Google Analytics to use this report.
With this report, you can filter based on the date the user was acquired. This way, you can know which visitors were acquired when a particular campaign was running.
Cohort Analysis
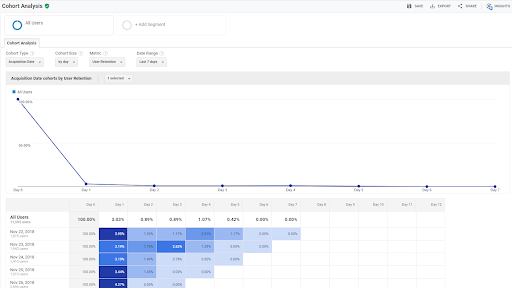
A user cohort refers to users who are segmented according to dates. A good illustration of a cohort is users who have been acquired on the same date.
To create a cohort report, you need to modify four selections:
Cohort type – This is the date on which your cohort will be based. At the moment, the only cohort type available is the Acquisition Date. However, you can use segmentation to get additional insights.
Cohort size – Do you want to see your cohort based on the day, week or month?
Metric – This refers to the data you’ll see in this report. You may either select aggregated metrics like page views or single-user metrics like sessions or per user transactions.
Date range – From which period to which period would you like to see the cohort data? You have the choice between 7, 14, 21 and 30 days.
User Explorer
For this report to be populated with data, you should go to your property settings and enable the User-ID feature. After completing the setup, this report shows you individual user behavior and not aggregate data.
For every user, you can see data such as the sessions, bounce rate, transactions, average session duration, revenue, and goal conversion rate. You also can see acquisition data as well as acquisition channel per user.
Are You Already Using Google Analytics Standard Reports
This article has shown you the more obscure parts of the Audience Report in Google Analytics. The rest like demographics, interests, geo, behavior, technology, and mobile have been addressed in other articles on Google Analytics Standard Reports.
Geeks of Digital is an analytics-driven online marketing and content production agency. We are experts when it comes to Google Analytics. Get in touch so we can use Analytics to take your business to the next level.

